
AI Adoption Is Broad, but Deep Use Is Still at 1%

Updated: Sep 9
The market has recently been arguing over one question: How large can AI ultimately become?
Yet when the market discusses AI, it often conflates two questions: how many companies have started paying for it, and how deeply those companies are actually using it. The first determines penetration; the second determines the revenue ceiling and demand for compute.
Public data show that corporate AI purchases are no longer confined to a small minority, but most spending still goes to chat, writing, and localized assistance. Only a small group of users has integrated models into daily workflows so they can continuously complete work that previously had to be handed back and forth between people. The real question today is not whether AI adoption has broadened, but whether this deep use can spread beyond the few.
If it can, demand will undergo a second acceleration. If it cannot, enterprise activation rates may continue to rise, but application revenue may still fail to catch up with the infrastructure investment already made, leaving the industry struggling to cross the chasm.
Separate Breadth from Depth
Among Ramp's corporate customers, 55.7% have recorded AI-related spending; the U.S. Census estimate is 21.6%. The two samples are not directly comparable: Ramp's customers skew toward digitally oriented companies, while the Census has broader coverage. But both point to the same conclusion—paid AI adoption has moved beyond the stage of being merely an experiment among a handful of technology companies.
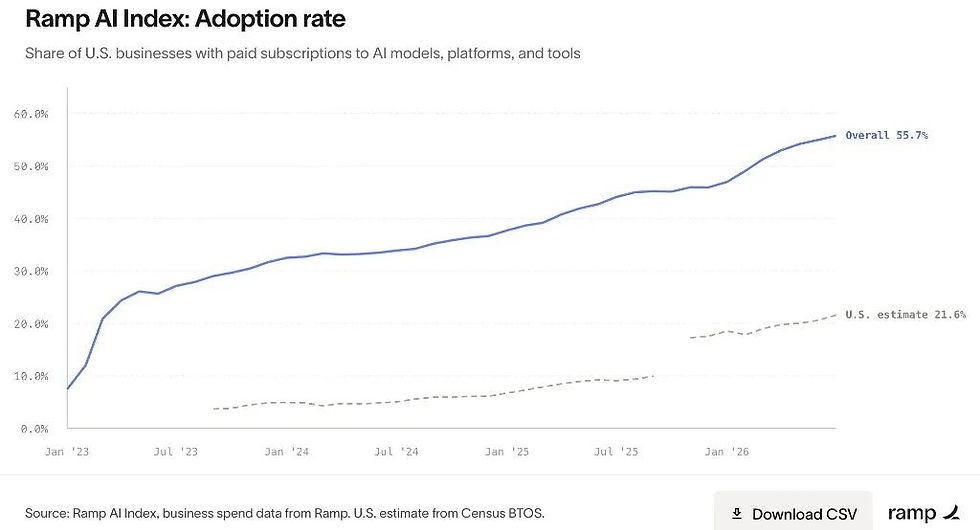
Figure: Among Ramp customers, 55.7% of companies pay to use AI; the U.S. Census estimate is 21.6%. Source: Ramp AI Index, July 2026. Ramp records actual spending on U.S. corporate cards. Because its customer base is more digitally oriented, the 55.7% figure cannot be extrapolated to nationwide penetration.
The gap widens immediately when spending is allocated per employee. The monthly median in Ramp's sample is only $11.95, the top 10% spend about $650, and the highest-spending 1% reach $7,400. $12 is close to the price of one chat subscription; $7,400 per month is about $89,000 a year, already close to the cost of a junior employee.

Figure: Monthly AI spending per employee. The highest-spending 1% began rising sharply in the second half of 2025, the top 10% moved up moderately, and the median remains close to the horizontal axis. Source: Ramp AI Index.
Over the past twelve months, the deepest 1% rose from about $1,900 to $7,400, nearly fourfold; the median increased only from $4.6 to about $12. Growth has not occurred evenly but has been concentrated at the far right of the distribution. The spending mix confirms this: usage-based payments account for about 51%, rented compute for about 15%, and subscriptions to chat and coding assistants for about 10% combined. What truly creates the gap is that models have begun to process tasks continuously, not that companies have opened a few more accounts.
Differences across industries also appear mainly in depth. The shares of paying companies in technology, finance, manufacturing, and restaurants and hotels are about 80.6%, 73.1%, 60.4%, and 31.9%, respectively. Yet median monthly spending per employee is about $79 in technology and only about $2 in restaurants and hotels. Activation rates differ by roughly 2.5 times, but per-employee spending differs by nearly 40 times. Large companies buy AI more broadly but spend only $3.39 per employee, while smaller companies have narrower paid coverage but spend $22.79 per employee. Accounts can be rolled out quickly; redesigning workflows takes much longer.

Figure: The x-axis shows the share of paying companies; the y-axis shows monthly AI spending per employee. The larger difference among industries is not whether they have activated AI, but how intensively they actually use it.
Why Most Enterprises Remain at the Shallow End
The problem is usually not that employees do not know how to prompt. It is how many times people still have to take over after the model produces an output. The model writes a section; a person checks and revises it, then copies it back into the original system; the next step starts over again. As long as the number of handoffs does not fall, AI accelerates only one stage while the overall process continues to run at human speed.
Programming reached deep use first not simply because developers were more willing to try new tools. Code is digital, its results can be tested, and errors can usually be rolled back, allowing models to keep working through successive steps. Hospitals, courts, production lines, and roads are different: the objects are not entirely on screen, mistakes are costly, and responsibility is difficult to transfer. As long as ultimate responsibility remains firmly with an individual, AI will struggle to move beyond the assistance layer.

Figure: Illustration. The left side resembles how median users work; the right resembles high-intensity users. If a person must check, revise, and transfer the output after every model step, the entire workflow remains constrained by human speed. Usage can rise sustainably only when intermediate handoffs are reduced.
Depth of use is therefore not simply an indicator of model capability. It also depends on whether a task is digital, whether results can be verified, whether errors can be reversed, and whether a company is willing to reallocate responsibility. Stronger models solve only part of the problem.
Our Own Sample: Why Did Usage Suddenly Rise?
BEDROCK is a relatively small investment research team whose work mainly takes place on computers: writing reports, updating financial models, and searching for materials. It cannot be used to infer when hospitals or factories will adopt AI, but it can help us observe one question—what happens to usage once models are genuinely integrated into workflows.
Initially, after a model completed one part of the work, a person still had to copy the result back into financial models and document repositories. Later, models could make changes directly in the original work objects, sharply reducing manual transfer. In August 2026, among six team members with complete records, reconcilable model usage rose from 40.8 billion to 65.0 billion in character-based billing units; usage in the deepest role increased from 25.9 billion to 51.4 billion. Meanwhile, the number of tasks initiated from scratch fell from 830 to 228, while usage per conversation increased by 153%. Fewer tasks and heavier individual tasks indicate that models had begun to process longer work chains continuously. People still provided final sign-off, but no longer had to take over at every step.
Higher total usage does not mean everyone uses AI equally deeply. The deepest user contributed about 79% of total usage, the second user about 10%, and the other four users about 11% combined. Everyone had long had an account, yet deep use remained concentrated in a small number of roles.
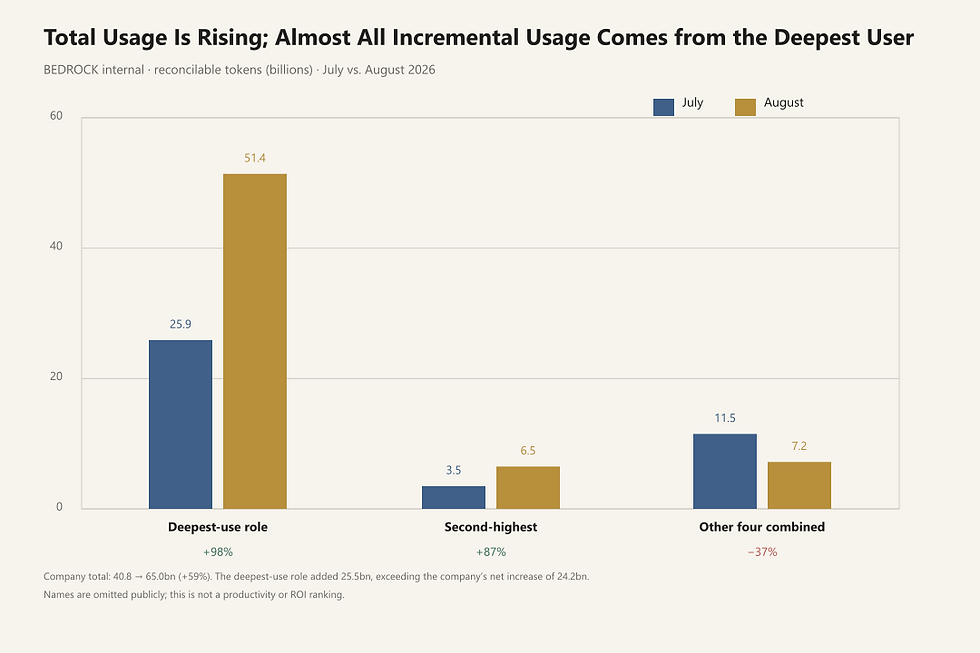
Figure: BEDROCK's reconcilable model usage in July and August 2026. Names are omitted from the public version. Total usage increased, but the increment was highly concentrated in the role with the deepest use.
This sample points in the same direction as Ramp, but the two measures cannot be divided directly. Ramp measures corporate card spending, while BEDROCK records internal model usage; the implied lower bound for the monthly cost of a high-intensity role is already about $26,000. What can be confirmed is not whether the two sets of figures are precisely comparable, but that they reflect the same mechanism: when AI moves from helping a person write one section to completing part of a workflow on the person's behalf, spending shifts from software seat fees toward the cost of a role.
Large Enterprises Face Even More Bottlenecks...
Large enterprises face heavier obstacles than small teams. Data are scattered across different systems, permissions are complex, legacy software is difficult to change, and responsibility must be assigned when something goes wrong. Chat accounts can be activated in a day, but connecting models to work that must be delivered every day often requires cross-departmental process redesign. Many companies do want to use AI; they simply cannot complete this engineering work on their own.
This is why Forward Deployed Engineers, or FDEs, have regained prominence. An FDE does not merely visit a customer to tune a few prompts; the job is to connect models, data, permissions, legacy systems, and acceptance criteria into an operational workflow. Industry interviews suggest that on-site teams spend roughly 70% to 80% of their time on these non-model components, and a typical project requires 8 to 50 people. This is precisely the break between having tried AI and being able to hand work over to it.
But this step is not easy. Among enterprises that have begun experimenting with AI, only about 5% ultimately scale it across the company—roughly one in twenty—while 70% to 80% remain in the pilot stage. The reasons are not only technical: companies must also decide what to do with the labor hours saved, who bears responsibility for errors, and how existing roles should be reorganized. Early enterprise software likewise depended on sales and implementation teams to educate customers, but today's challenge is not merely teaching people to activate a product; it is persuading companies to entrust workflows to a system.
In May 2026, OpenAI made enterprise deployment a standalone strategic priority. Public materials indicated an initial team of about 150 people and mentioned an investment of more than $4 billion. Anthropic and Microsoft are expanding similar teams, while Palantir began turning field experience into products much earlier. For investors, the key question is not who deploys more people, but whether field work can continually be converted into reusable software. If people can leave after deployment while usage keeps growing, it is a product; if every new customer requires a new on-site team, then no matter how quickly revenue grows, the business remains closer to consulting, constraining both gross margin and the pace of expansion.
The spread of deep use is often driven not by better training but by competitive pressure. Within a team, a few high-intensity users can initially deliver results to everyone else. Once one company hires fewer people or delivers faster as a result, competitors are forced to follow. The first wave of diffusion happens between companies; only the second happens within companies.
How Much Low-Hanging Fruit Remains?
AI has vast long-term potential, but not all labor compensation can be treated as next year's software revenue. Nurses must care for patients in hospital rooms, teachers must stand in classrooms, and workers must operate equipment on site. The current wave of AI can first affect roles already performed in front of screens and organized around code, spreadsheets, documents, and information flows.
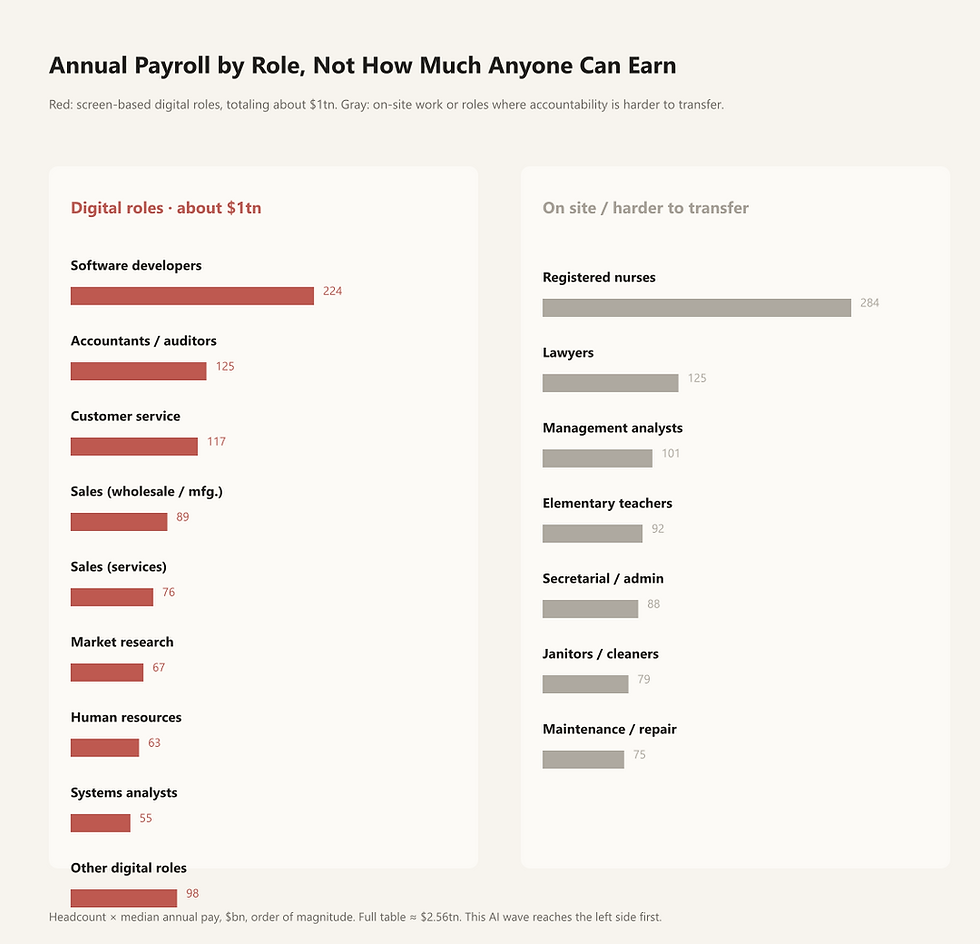
Figure: Headcount multiplied by median annual salary. Red represents digital roles that are currently easier for AI to reach, totaling about $1 trillion; the entire table totals about $2.56 trillion and includes substantial work that still requires people on site. This measures the wage pool, not the revenue available to any one company.
For software developers, the median annual salary is about $130,000, while a $2,400 annual subscription costs less than 2% of salary. If AI remains only a subscription tool, its price will struggle to break away from traditional software budgets. Once it can reliably replace part of the work hours, the pricing benchmark can begin to move toward the cost of a role. The deepest 1% discussed above already spend about $89,000 a year, more than 60% of the annual salary for this type of role.
To assess whether today's trillion-dollar-scale investment in chips and data centers can earn a return, demand can be divided into four layers. Each layer is larger than the one before it, and harder to realize.
Layer One: Chat and coding subscriptions. Even if global scale grows by another order of magnitude, the market would still be roughly $0.1 trillion. It would prove that users are willing to pay, but would not by itself support today's infrastructure investment.
Layer Two: Usage-based payments and systems capable of completing tasks. Pricing here begins to correspond to actual work hours. Based on media estimates in mid-2026, Anthropic's annualized revenue was about $65 billion and OpenAI's about $40 billion, or roughly $100 billion combined. These are not audited figures; OpenAI's consumer subscriptions are included, while Microsoft, Google, Amazon, Cursor, and others are not. The $100 billion figure should therefore be viewed only as the visible lower bound. If accounting, customer service, and sales gradually enter this layer alongside programming, the market could move from about $0.1 trillion toward several hundred billion dollars, and potentially approach $1 trillion.
Layer Three: Broad transformation of knowledge work. Using an estimate of about 1.1 billion knowledge workers and average annual spending of $3,000 per person, the theoretical scale is about $3 trillion. But this is a long-term scenario, not next year's revenue. Even if only 10% of workers reach the current high-spending enterprise average of about $7,800 a year, the total would be only about $0.09 trillion, still within Layer Two.
Layer Four: Labor compensation itself. Labor compensation is about $16 trillion in the United States and about $60 trillion globally. This is the farthest economic ceiling, and most of the work included still requires people on site, so it cannot be inserted directly into AI revenue forecasts.
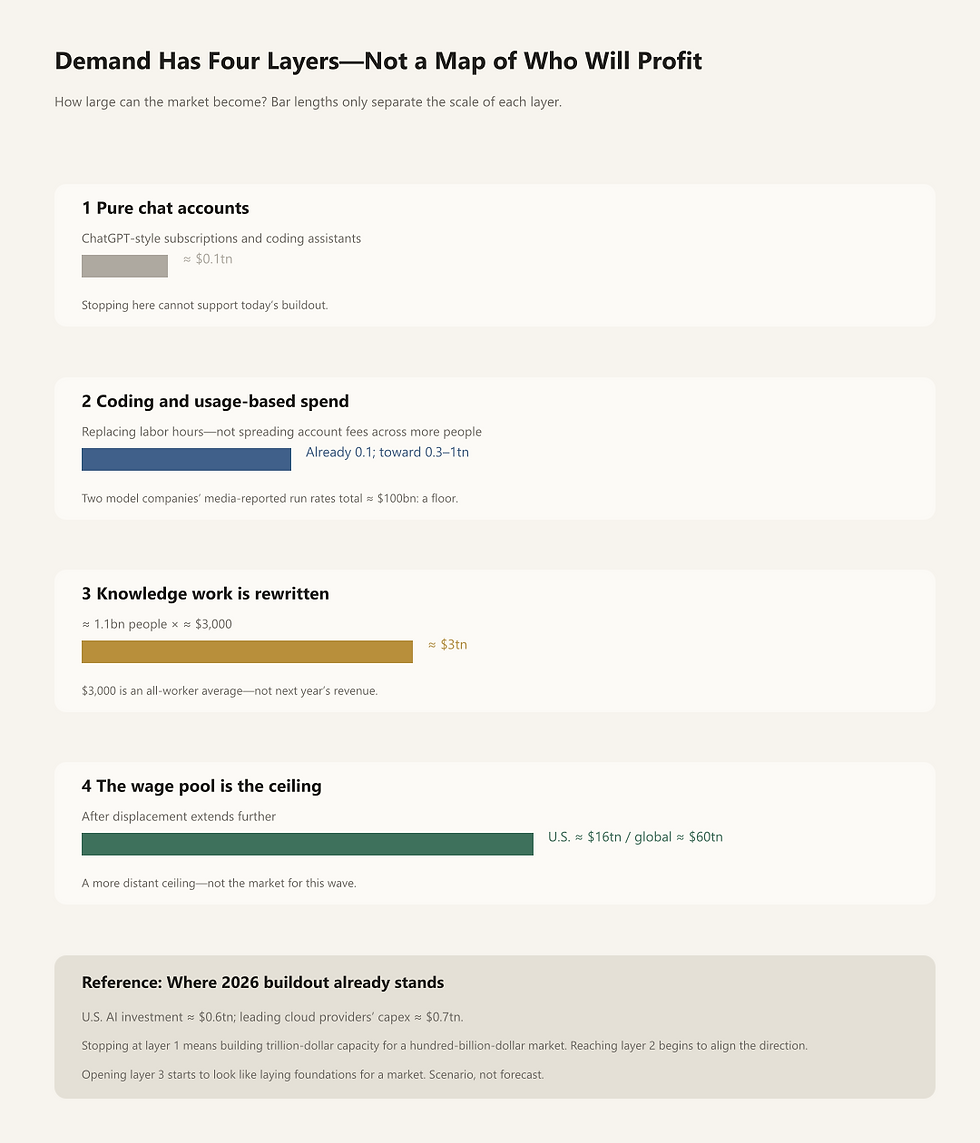
Figure: Scenario scale for the four layers of demand. Bar length illustrates only the differences among layers and is not a forecast. A large ultimate demand opportunity does not mean that every model or application company will earn the same revenue and profit.
These four layers are better understood as an opportunity map than as revenue targets. What must be continuously tested is where AI revenue currently sits, how quickly it is moving to the next layer, and who in the value chain can retain pricing power. Optimism about ultimate demand does not mean that every model company deserves the same optimistic profit forecast.
The Next S-Curve Depends on Whether Depth Can Spread
Enterprise AI adoption has at least two curves. The first is activation and payment; more than half of Ramp's sample has already crossed that threshold, and future growth is more likely to be gradual. The second is workflow transformation. So far, only the deepest 1% show a clear inflection, while the top 10% have risen only moderately. Application revenue and demand for compute will accelerate again only when the second curve begins spreading to more companies.

Figure: Illustration, not a forecast. Account penetration has reached the middle stage, while workflow transformation remains early. The question is when the latter will begin to rise.
A simplified example illustrates the difference. Suppose that among 100 companies, one spends $7,400 per employee each month, nine spend $250, and the other 90 spend $12. Total spending is about $10,700. If the latter 90 companies merely buy a few more chat accounts, the total changes little. If another nine companies also rise to $7,400, total spending approaches $75,000—about seven times the original amount. What changes the size of the overall market is not the number of accounts, but how many companies complete workflow transformation.
BEDROCK's base case is that paid coverage will continue to rise over the next 12 to 18 months, but deep use is more likely to retain a pattern in which a few users go very deep while most remain shallow. The second curve could accelerate suddenly, but that will not happen automatically as models improve. Applying the roughly 32% activation rate in restaurants and hotels directly to per-employee spending in manufacturing or technology would materially overestimate near-term demand.
Rather than continuing to track how many more companies have opened accounts, the following indicators deserve closer attention:
Is the per-employee spending gap between the highest-spending 1% and the top 10% narrowing? It is currently about 11 times. What truly matters is whether the top 10% move materially higher, not whether the deepest 1% continue to grow alone. Can median monthly spending per employee move beyond $10 to $20, and can large enterprises move beyond roughly $3? Only when both figures rise will depth diffusion cease to be confined to a few samples. How many human handoffs does a real task require, and can a model reliably complete it to a deliverable standard? If handoffs do not decline, efficiency remains locked to human speed. Does usage continue growing after the FDE team withdraws? If the workflow keeps running after the on-site team leaves, the experience has been productized; otherwise it remains a labor-intensive project business. Are the shares of usage-based payments, rented compute, and application revenue rising within total spending, and is their gap with chip and data-center construction spending narrowing or widening?
Programmers are not permanently a separate class; their work simply satisfied the three conditions of being digital, testable, and reversible earlier than other occupations. Whether other knowledge roles follow depends on models achieving comparable reliability and on companies redesigning workflows and responsibility arrangements.
Today's market consists of a broad but still shallow majority, alongside a small leading group whose AI use is already deep. The key to the next stage is not more people having AI accounts, but more real tasks being completed with fewer human handoffs. Until then, the more prudent modeling assumption remains that penetration will continue to rise, depth of use will diffuse slowly, and incremental revenue will remain concentrated among high-intensity users and digital roles where closed-loop workflows are easiest to establish.
Disclaimer: The content above is provided solely for market research and the exchange of views. It does not constitute investment advice or any commitment. The data cited are drawn from public information and market estimates and may change as information is updated.


Comments